
In this unit you will review the following points:
- An overview of the writing test, Task 1
- Interpreting Task 1 questions
- Interpreting and describing visual information: Pie charts and bar charts
- Linking different points
- Useful vocabulary: Statistics
- Checking content and language errors
2. Interpreting Task 1 questions.

Read the Task 1 questions and decide what each one is asking you to do.
3. Interpreting visual information.
Look at the two illustrations and choose the correct answers for the questions below.

4. Linking information.
TIP:
Use linkers to add, contrast or balance different points, to describe cause and effect, and to give reasons.Match the two parts to complete the sentences.
5. Linking information.
Read the following sentences containing linkers and decide whether or not they make sense.
6. Linking words and phrases.
Choose the correct options to complete the table of linking words and phrases.
8. Useful vocabulary: Statistics.
Read a sample question for Task 1 of the writing test.
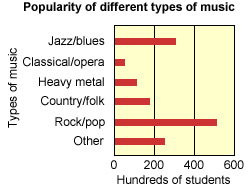
The charts below show the results of a survey conducted among 15- to 25-year-old students in Fukuyama, Japan. The pie chart below shows the preferred way to listen to music. The bar chart shows the popularity of different music types.
Write a report for a university lecturer describing the information shown below
Use the nouns below to complete a sample answer.
9. Useful vocabulary: Verbs.
Choose the most appropriate verbs to complete the answer from exercise 8.
10. Finding language errors.
TIP:
Always check your writing for language errors.Look at the sample answer again below and select the incorrect words to delete them. There are 14.
12. Practice question.
Read the instructions and write your answer. Remember to:
- make sure that you understand what the question asks you to do.
- include an overview of the information as an introduction.
- only describe relevant information.
- cover all the key features in the visual information, even if you just mention some of them.
- use a range of appropriate nouns and verbs.
- use a range of words and phrases to link different points.
- check your writing for language errors.
Writing Task 1
You should spend a maximum of 20 minutes on this task.
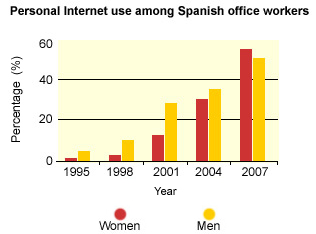
The chart below gives information on Internet use for personal interests among Spanish office workers.
Summarise the information by selecting and reporting the main features, and make comparisons where relevant.
Write at least 150 words.
When you have completed the writing task, you can look at a sample answer. Compare the sample answer with your own.
This bar chart shows the use of Internet for personal interest among Spanish office workers, covering the period from 1995 to 2007.
The data is divided by gender, and dramatically demonstrates the increase in personal Internet use by both men and women during this period. In the first four years shown on the chart, we can clearly see that men made consistently more use of the Internet at work than women, with the difference being most marked in the year 2001.
In 1995, women's personal use of the Internet was almost insignificant, whereas approximately 4% of men were using it. This trend continued in 1998, with men's use of the Internet doubling, while women were still not showing significant interest. The year 2001 showed a substantial change to this situation, with both men's and women's personal Internet use soaring into double figures, though there were still over twice as many men using it than women. By 2004, this difference had diminished substantially, with men's and women's Internet use being almost equal.
Finally, 2007 saw the most significant change to the previous pattern, with women's personal use of the Internet overtaking men's, and with both men's and women's figures exceeding 50%.