In this unit you will review the following points:

  • Dos and don'ts for Task 1
  • Selecting information
  • Organising ideas
  • Writing introductions
  • Writing conclusions
  • Describing graphs
  • Describing numbers
  • Useful vocabulary: Tendencies

1. Do or don't?

Drag the information to the correct box to complete advice for Task 1 of the writing test.

2. Selecting information.

TIP:

It is important to select the information you refer to in your answer carefully. Not all information that you are given will be relevant.

Make sure that you cover all the key features in the visual information, even if you just mention some of them. If you don’t cover all the key features, your mark will be limited to a band score of 4.

Read a sample question for Task 1 of the writing test.

Writing Task 1
You should spend about 20 minutes on this task.

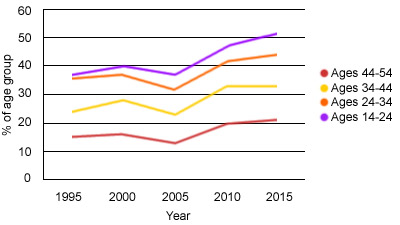
The line graph below gives information on cinema attendance in Hong Kong. Summarise the information by selecting and reporting the main features and making comparisons where relevant.

Write at least 150 words.

Cinema attendance in Hong Kong

The information below relates to various aspects of the graph. Decide which information should be included.

3. Organisation.

TIP:

Before you start writing, it is important to have a clear idea of the organisation of your answer.

Look at the following suggestions for organising an answer to the question in the previous exercise. Which one is the most appropriate? If you need to, you can read the question again.

4. Matching language and functions.

Look again at the sample question for Task 1 of the writing test.

Writing Task 1
You should spend about 20 minutes on this task.

The line graph below gives information on cinema attendance in Hong Kong. Summarise the information by selecting and reporting the main features and making comparisons where relevant.

Write at least 150 words.

Cinema attendance in Hong Kong

Now read the extracts from a sample answer to the question and choose the option which best describes each extract.

5. Writing an introduction.

TIP:

Your answer should begin with an introduction and end with a summary of the information that you are given.

Remember: You must give a clear overview of the information that is provided, rephrasing the description that is given. If the overview is missing, your mark will be limited to a band score of 5.

Read the following possible introductions to the sample answer and decide which one is the most appropriate. If you need to, you can read the question again.

6. Summarising.

Choose the correct option to complete the summary extracts.

7. A sample answer.

Look again at the sample question for Task 1 of the writing test.

Writing Task 1
You should spend about 20 minutes on this task.

The line graph below gives information on cinema attendance in Hong Kong. Summarise the information by selecting and reporting the main features and making comparisons where relevant.

Write at least 150 words.

Cinema attendance in Hong Kong

Use the words in the box to complete the sample answer to the Task 1 question.

8. Describing graphs.

Look at the graphs and choose the better description of the main features of the movement of the line.

9. Review useful language.

Review useful language for describing the movement of a line on a graph. Complete the charts by typing the missing words.

10. Describing numbers.

Numbers can be described in various ways.

Look at these examples:

A substantially larger percentage of people ...
It is predicted that approximately 51% of the respondents ...
More than half of the people surveyed ...
The majority of people asked ...

Complete the chart with different ways to describe numbers.

11. Describing numbers of people.

Choose the expression with the same meaning.

12. Text reconstruction.

Choose the correct options to reconstruct the first part of the text.

13. Practice question.

Read the instructions and write your answer. Remember to:

  • select appropriate information to include in your answer.
  • organise your writing so that it answers the question.
  • include an introduction and a summarising statement if appropriate.
  • avoid repetition and copying parts of the question.
  • describe visual information accurately.

Writing Task 1
You should spend a maximum of 20 minutes on this task.

In June 2004, an experimental flu vaccine was trialled in a large country town on females only.

Summarise the information by selecting and reporting the main features and making comparisons where relevant.

Write at least 150 words.


When you have completed the writing task, you can look at a sample answer. Compare the sample answer with your own.

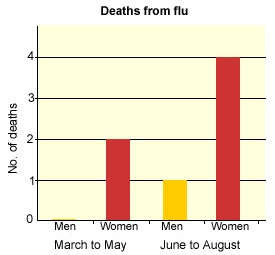
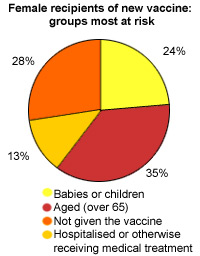
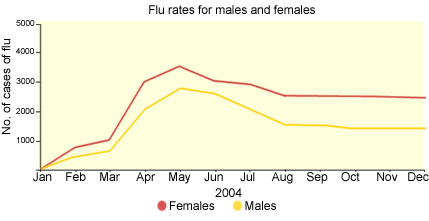
The three diagrams show data for a flu epidemic affecting a large country town in 2004. Figure 1 gives the number of deaths; Figure 2 shows the percentage breakdown of females given a new flu vaccine; and Figure 3 gives the number of flu cases before and during the epidemic.

According to Figure 1, the flu caused the deaths of 2 females but no males in the period from March to May. However, from June to August, there were 4 female deaths and 1 male death.

The pie chart in Figure 2 indicates that only those females most at risk received the new flu vaccine; 28% did not take part in the trial. Of those females taking part, over 30% were aged over 65, approximately 25% were babies or children, and 13% were either hospitalised or receiving other medical attention.

Figure 3 shows that the new vaccine had a positive effect on the number of new cases of flu reported in females. There were just over 1,000 cases reported in March, peaking rapidly at 3,500 in June. Thereafter, the number of cases dropped slowly to about 2,800 in August, before levelling off at 2,500 for the rest of the year.

On the whole, the figures followed a similar trend for both sexes throughout the epidemic, although males were less affected than females.